
BOOSTER assessment · free
Assess the health of your deviation handling process in a few minutes
Upload a simple extract of your deviations: you get your open items, backlog, lead times, classifications and an automatic reading of your results, with suggested actions.
- A reduced extract is enough: numbers, dates and a classification. No titles, product names or people’s names.
- Works with the export from your quality software or your Excel tracking file.
- Your data never leaves your computer: nothing is sent, nothing is stored.
Access the analysis tool
Free, no installation. Immediate access after submitting the form.
What you get
How does it work?
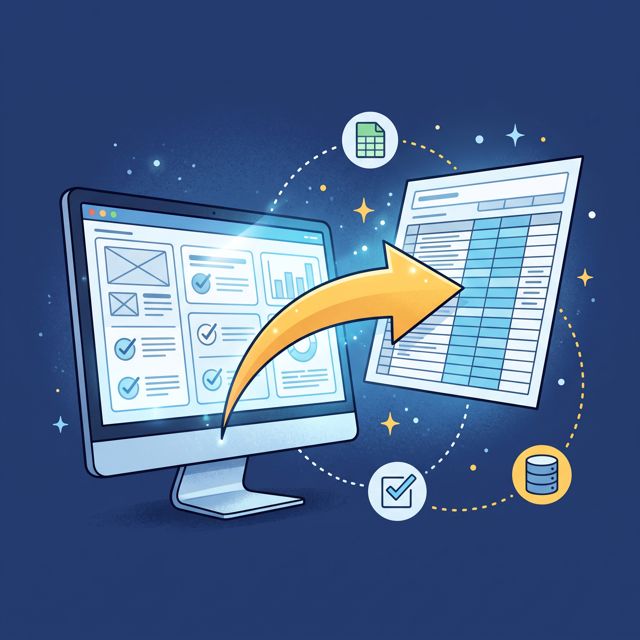 Make your extractFrom your quality software or tracking file, with one row per deviation. A template is available in the tool.
 Upload it to the toolColumns and classifications are recognised automatically: all you have to do is check.
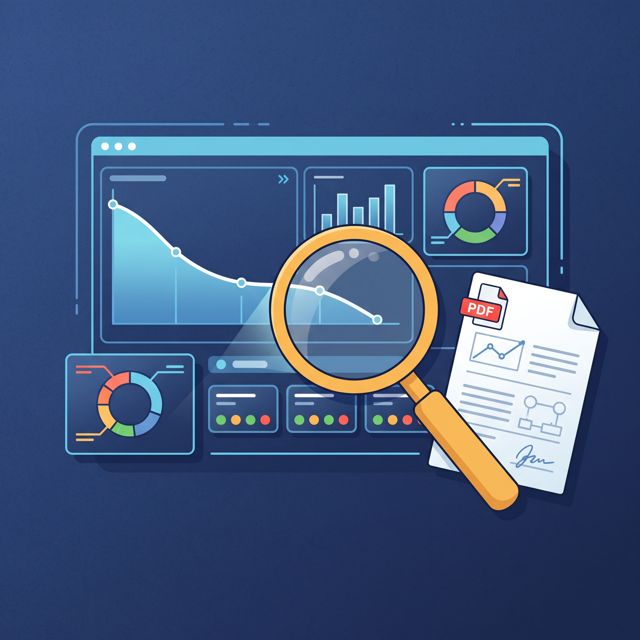 Read your resultsCharts, indicators and an automatic reading, which you can save as a PDF for your teams.
The only columns needed
To extract
- Deviation no. required
- Opening date required
- Closure date required
- Classification (minor, major, critical…) required
- Status or current step optional
- Department or scope optional
- Detection, assessment, end-of-investigation and target dates optional
No need to include
- deviation titles and descriptions
- product names and batch numbers
- people’s names
- causes, CAPAs, comments
So your extract contains no sensitive information.
Your data stays with you
Frequently asked questions
What data do I need?
A simple extract of your deviations, from your quality software or Excel tracking file: at a minimum the number, opening date, closure date and classification. Two years of history give the best reading.
Is my data sent to A-QE?
No. Your file is read and analysed directly in your browser. It isn’t sent to any server and nothing is kept when you close the page. You alone decide, at the end, whether or not to send a summary of your indicators.
How can I be sure my data doesn’t go out on the internet?
The simplest way is to check for yourself: once the tool page has loaded, turn off your internet connection (Wi-Fi off or airplane mode) and upload your file. The analysis works exactly the same way, proof that nothing is sent. And since the extract contains only numbers, dates and classifications, no sensitive information is at stake.
Do I need to install anything?
No. The tool runs in your browser, with no macros or installation: no risk to your computer.
What should I do with my results?
You can save your report as a PDF to share internally, and send us your summary for a free 30-minute debrief with a consultant.